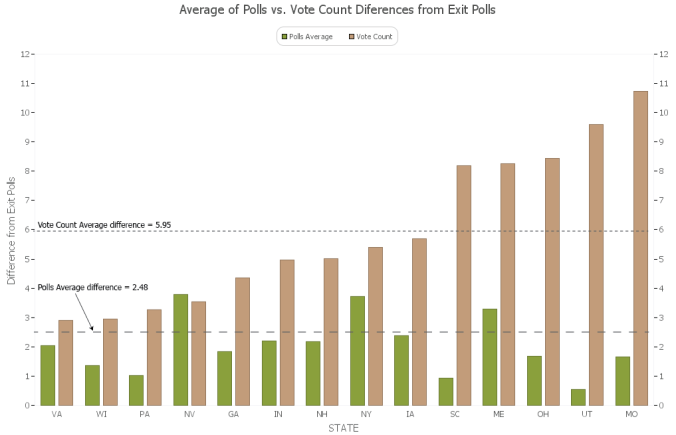
Figure 1. Differences from exit polls, comparing a combined average from polls against the vote count (for states in which the margin of error of the vote count exceeds the margin of error of the exit polls).
Many have identified discrepancies between the 2016 presidential vote counts with the exit polls. The preliminary polls are also good to check. The punditry have generally dismissed the pollsters as just being wrong this year (even while they placed a great deal of trust in them right up until the day of voting). One way to check the polls, though, is to evaluate the final polls against the exit polls. In the chart above (Figure 1), I compare the differences of five polls against the vote count for the differences from the exit polls.
Earlier, I had posted a table comparing the final poll forecasts of FiveThirtyEight against the Exit Polls and the vote counts. This chart indicates the average of four poll-tracking sites: TalkingPointsMemo, Huffington Post, RealClearPolitics, as well as FiveThirtyEight. I include states for which the vote counts exceed the margin of error by greater than 1% (I also exclude New Jersey, as an outlier); so, all other states (of the 28 with exit polls) exhibit closer proximity between vote counts and exit poll results.
The pattern here is that the polls average difference of 2.48%, which is an acceptable margin of error from the exit polls. The vote count in these states, however, exceeds the exit polls by nearly 6% (+5.95).
FiveThirtyEight exhibited the closest forecast-to-exit-poll differences at 2.04. The other sites were close, with Huffington Post averaging 2.48, TalkingPointsMemo averaging 2.58, and RealClearPolitics averaging 3.13 points difference from the exit polls.
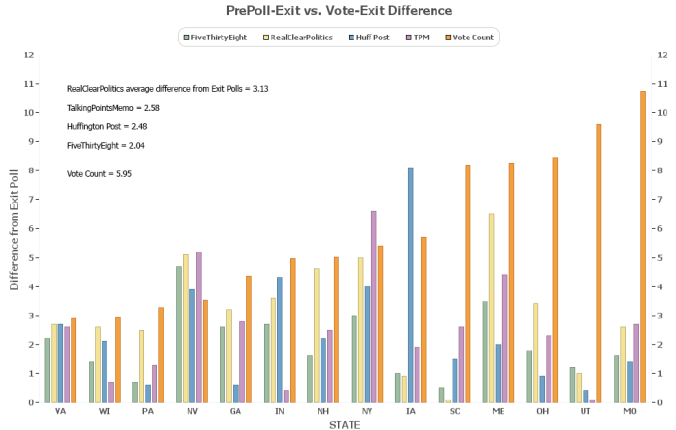
Figure 2. Differences from exit polls, comparing individual polling sites against the vote count (for states in which the margin of error of the vote count exceeds the margin of error of the exit polls).
Jill Stein is focusing attention on Wisconsin, Michigan, and Pennsylvania, which have closer margins of victory. Other irregularities beyond differences from exit polls are figuring into those states, in addition to the unexpected flipping of those states for Trump.
Here, these comparisons indicate substantial discrepancies of the vote count to both the exit polls and the preliminary polling in Iowa, South Carolina, Maine, Ohio, and Missouri, each of which was contentious in this election; we could also include Georgia, Indiana, and New Hampshire (Utah is an outlier here given the prominence of McMullen’s candidacy*). The difference with Missouri is quite stark, with 10.7 points difference from the exit polls; all of the pollsters were within ± 2.08 points of the exit polls for the state.
Although Stein is focusing audits on those three states of Wisconsin, Pennsylvania, and Michigan, the indications here are that irregularities appear to be occuring in numerous states, especially among those in contention.
*If we exclude Utah from the charts, the average difference of the pollsters rises slightly to 3.3 points from the exit polls, while the vote count average difference is slightly higher at 6.1 points. So, the vote count discrepancies are nearly double that of the pollsters.
